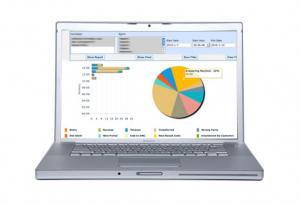

Generate data reports in a diagrammatic format that will allow you to view and process multiple hierarchy of data subsets and grid relations in a simple work flow enabling you to get in depth data analysis reports about various situations.
Using complex techniques to search for data and generate data reports by indexing and query processing techniques it is possible to view data in multiple column format in a simple click and browse viewing.

Generate reports from the data collected from the devices, web and manual data entry with extensive data relations organized as groups and trees, coupled through data object relations and sum mated according to logic, to create charts, graphs, animations, images and tables, and embed data onto maps or structure for easy understanding.Unlike general solutions our solutions are always custom built to your organization needs and complexity and it is hence possible to provide inference data for your organizations existing data.Targeted advertisements for targeted audience

Reports are generated as excel documents, word documents, XML documents with schema. Open office documents access database output, pictorial representation, map representation, graph representation and animations are supported.
The formats can be further stored as log files for quick representational purposes.
The products can be bundled into packaged products to attract more customers
Customers can then be given option to order products that are not readily available or old stock. This can be made available and delivered according to orders.

Endless filtering possibilities can be created with step by step filter options requesting, while report is being prepared. These options enable the reporting solution to provide you with the data that does not confuse you and is in simple terms the data that you need for business analysis

Sometimes it is required to group items by ranges and name each range for the purpose of data generation.The endless possibilities to generate reports by combining them, allow you to do things that your normal excel reports may find difficult to support.

All reports are usually two dimensional ie. rows and columns. But for data viewing and to find out why a number in the report seems to look different may be hard. Our variable dimensional reporting engine allows you to browse through your reports like a three dimensional cube that has endless sides enabling you to look into data where there is need to be more discrepancy and hence find the cause of the discrepancy
